


Scientists and architects are pioneering a new cartography for blind users.
Sighted people read maps almost every day. Maps help us get off at the right subway station, grasp global affairs, plan museum trips, and remember the new office floorplan. And our use of maps, and sense of what they represent, is based almost entirely on looking at them.
So it’s disorienting to think about navigating a new place without a map—let alone without sight, like most of the 285 million people in the world who are visually impaired do everyday. But a group of scientists, architects, and advocates are working toward on new methods of wayfinding for blind people: They’re making maps that convey information through touch and sound.
Maps for Transit
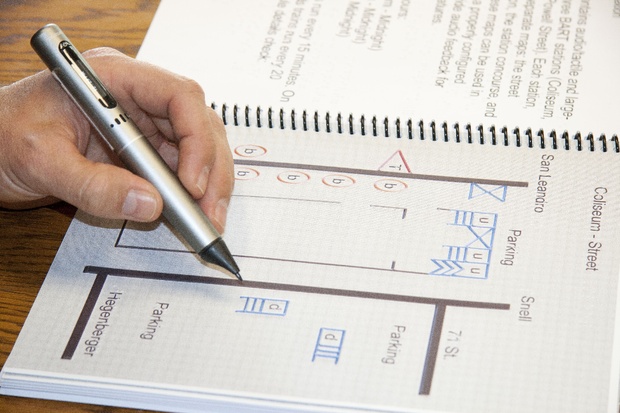
Using maps is a major part of using public transit. That’s why Dr. Joshua Miele, a scientist at the Smith-Kettlewell Eye Research Institute in San Francisco, partnered with LightHouse, a local organization for the blind, to create accessible maps of every BART transit station.
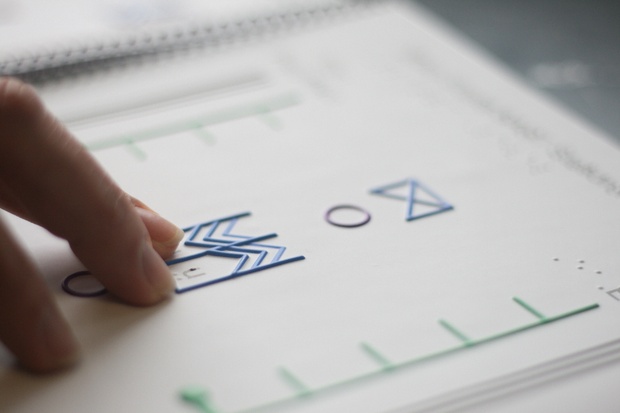
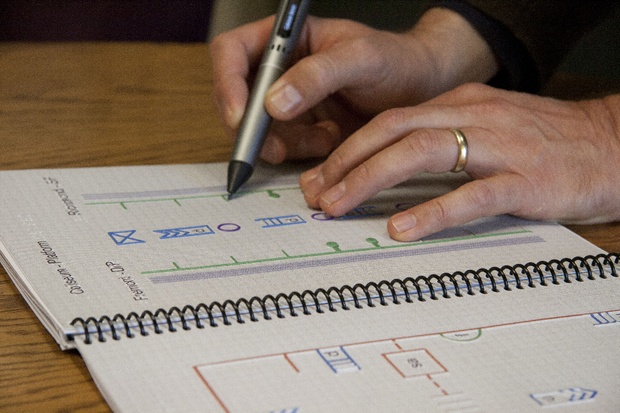
Made on an embossing printer, the maps are tactile, large-print, and have an audio component: By using a Livescribe smart-pen, users can tap on icons (a ticket booth or a exit, say) and listen to more detailed information (how much for a fare, or what intersection the stairs lead to). Advocates at LightHouse have been distributing the maps and pens to clients and teachers since June.
From our partners:
“This is really the first time [a visually impaired person] can sit in their living room and orient themselves to a BART station that they plan on visiting, plan a path of travel from the entrance, to the turnstyles, to the platform, and then off the train and to the bus stop,” says Miele. “That’s really special.”
With degrees in physics and psychoacoustics, Miele has dedicated more than 25 years to improving visually impaired people’s access to information, with a particular focus on creating accessible maps—where he is truly at the frontier. Having lost his sight at age four, Miele knows firsthand about the dearth of cartographic information that’s historically been available for blind people, despite how helpful maps can be to them.
“For a very long time, there was research out there implying blind people couldn’t use tactile maps,” he says. “As a blind person, and as a researcher, I’m sort of shocked at this, because it’s just not true.” Spatial cognition is not uniquely visual, he says. “Blind people with good orientation and mobility skills have excellent spatial cognition, because we have to.”
[infobox]”My biggest goal is for blind people to not only be able to use maps like these universally, but to expect them, want them, ask for them.”[/infobox]Though those old studies have been debunked, Miele says that the blind and visually impaired community still has a pretty low level of tactile literacy: Not meaning reading Braille, but being able to explore and understand tactile graphic representations. Good design is key to changing that. “With a visual map, you can always take a closer look, magnify or zoom in, or squint at it,” says Miele. “But with a tactile map, there’s no zooming in or squinting. It’s at the resolution it’s at. So you need to be careful with how much stuff you put on it, because it can get cluttered easily.”
He realized quickly that using Braille sometimes limits a maps’s effectiveness, since it comes in only one large font size. That’s where the audio component comes in.
Still, it’ll be a while before every city has its own tactile transit maps, since according to Miele, “they’re not something any old person can make,” and the demand isn’t there—yet. “My biggest goal is for blind people to not only be able to use maps like these universally,” he says, “but to expect them, want them, ask for them, and use them in a way that improves their ability to get out there in the world and do the things they want to do.”
Maps for Learning
Dr. Colleen Farmer is an Associate Professor of Evolutionary and Organismal Biology at the University of Utah, and has been teaching comparative morphology (basically, the science of classifying living things by their body structures) to college students for years. But when she was invited to a workshop for young blind students called Science Without Sight in 2009, her focus shifted.
“I had an epiphany that morphology is an ideal science for blind children to interact with,” Farmer, who is sighted, says. “A lot of sciences are very visual—you need a microscope or a telescope. But with morphology, you can feel.” She describes how she had workshop participants feel the toothy skull of an allosaurus, and then the frilled skull of a triceratops cousin: It was an engaging tactile comparison, and a launching point for discussing different kinds of dinosaurs.
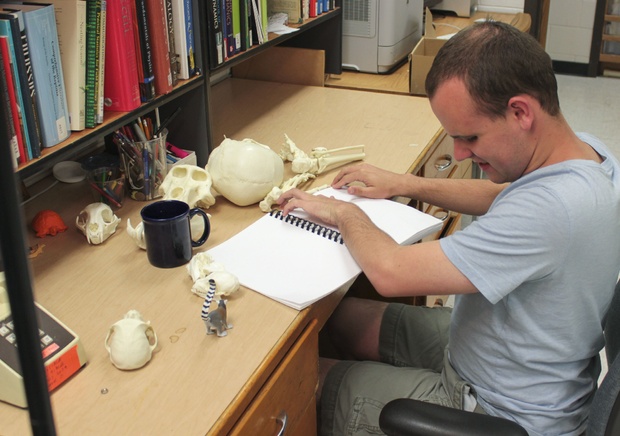
Armed with positive feedback from students and teachers, Farmer set about creating science kits for visually impaired K-12 students, in collaboration with the National Federation for the Blind. The two kits prototyped so far cover primate evolution and the ecology of the Galapagos Islands, using audio and Braille lesson plans, 3-D-printed models of skulls and tortoise shells, games, and tactile maps. Those last tools are essential, says Bob Cieri, a PhD student working with Farmer.
[infobox]”A lot of sciences are very visual—you need a microscope or a telescope. But with morphology, you can feel.”[/infobox]“The concepts being taught in the Galapagos box have to do with biogeography—the study of the distribution of plants and animals,” he says. “Because the tortoises evolved in the Galapagos by moving from the mainland and then from island to island, the students [use the maps] to question how the differences in shell shape are related to which tortoise is on each island.”
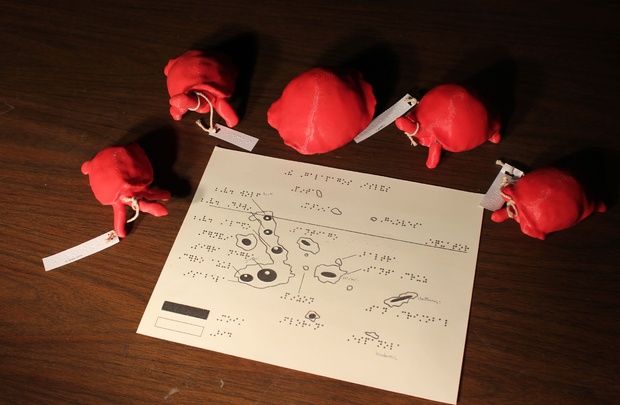
Galapagos tortoises. (Bob Cieri).
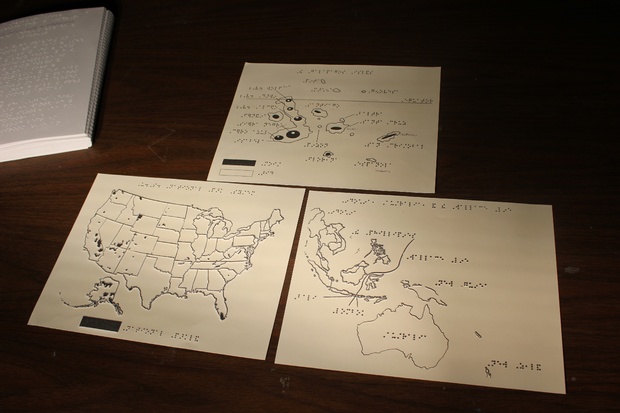
teach about island biogeography theory. (Bob Cieri).
Farmer has partnered with the Natural History Museum of Utah to distribute the kits, free of charge, to any local classrooms that want them. She hopes to expand their reach and hopefully inspire other scientists to develop kits based on their own areas of research. At a recent conference, Farmer says she met a grad student working on mapping the deep sea. “She had the idea that for blind students, you could use sound to explain different parts of the seafloor,” Farmer says. “It’s a good idea, not one I would have thought of.”
Maps for Design
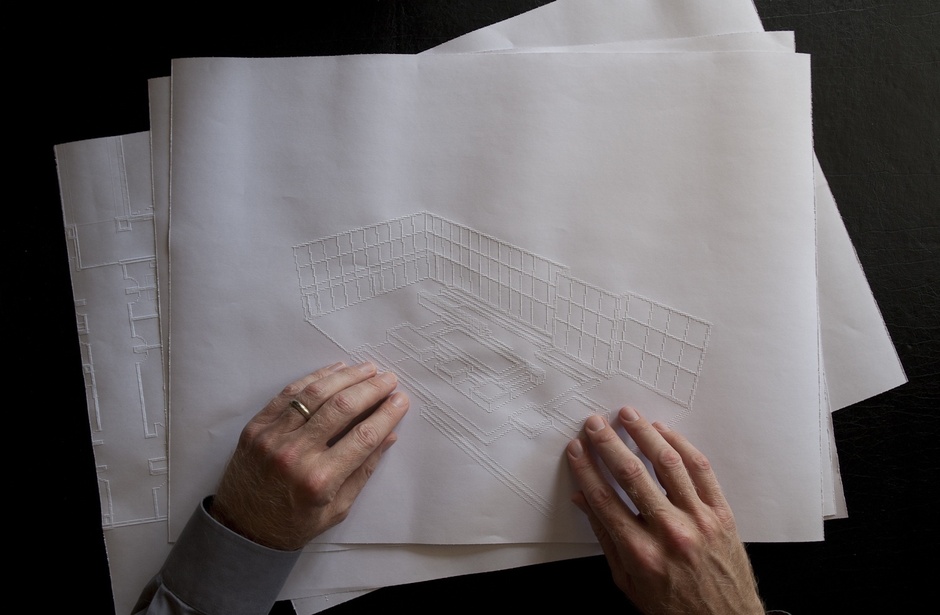
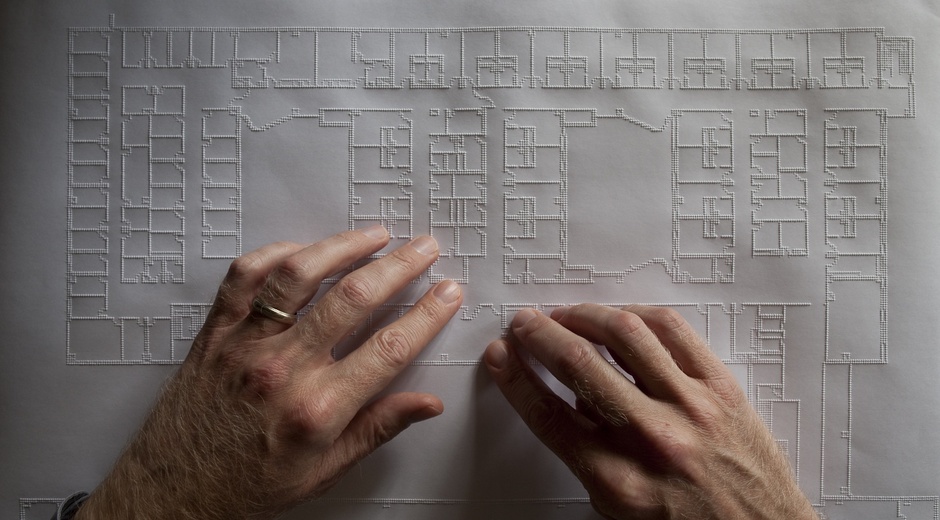
When San Francisco architect Chris Downey lost his sight to a non-cancerous brain tumor in 2008, he was back in the office within a month. Giving up his practice was not an option—he just had to figure out how to do it. “The idea of tactile graphics became significant in my ability to produce work,” Downey says. “Within short order, we were able to get a embossing printer and start doing tactile prints of drawings.”
Now, Downey uses tactile plans at his busy architectural consulting firm, Architecture for the Blind. He’s collaborating on the design of a new space for the LightHouse, consulting on accessibility issues for BART, and working on plans for the new Transbay Transit Center and platform designs for AC Transit’s rapid bus system.

Tactile plans presented a steep learning curve. “I had a lot graphic understanding from my training, but I had no touch,” he says. “I had very little development of my fingertips as a graphical input for reading drawings. I really had to focus.”
With visual architectural plans, Downey says, “there are graphic strategies that are standard in the profession. Color and tone can show overlapping information. Long arrows can point to details. Grid lines help organize the space.” But with tactile prints, all of that becomes noise. “You really have to simplify to get rid of any unnecessary info.”
[infobox]”Architecture is so much about how things look. I’m interested in how a building is experienced when you touch it with your hand.”[/infobox]Downey also points out how the basic hierarchy of information changes when you explore maps as a visually impaired person. “If you see a drawing or a map visually, you have the overall understanding of the space first. And then you drill into detail,” he says. “When you read with fingers, you start with detail first, and you may not have a clue what that detail is. You have to piece it together or find some strategy to find the overall picture.”
But it’s attention to detail that guides Downey’s current practice of universal design—architecture that seeks to be as accessible to as many kinds of people as possible. “I think about non-visual design, which comes from my experience, but also from a general critique of architecture,” he says. “It’s so much about how things look. I’m interested in how a building is experienced when you touch it with your hand, when you grab a railing or lean into an atrium.”
Floors are important, too: On a past project for a disabilities nonprofit, Downey described how he used different kinds of flooring—cork and polished concrete—to help the visually impaired differentiate offices from common spaces. On the subject of doors: “You can learn so much about how much a designer cares by the the level of interface of the door handle in front,” Downey says. “It’s like the handshake of a building.”
Downey and Miele both described how important GPS-based navigational tools like Google Maps, BlindSquare, and Uber have been for mobilizing the visually impaired community. But both also pointed to the unique power of a physical map, and how important it is to increase tactile literacy among the visually impaired. “With a map, you get a global view of space around you,” says Downey. “And that makes it easier the next time you go.”
This article originally appeared in CityLab.

From our partners: