


Bristol is the ‘green capital’ of Europe, but its predecessor Copenhagen comes top in a Europe-wide index. Curitiba, San Francisco and Singapore all have strong eco-friendly claims too – so what’s the best way to compare cities’ greenness?
It’s easy to say we’d like our cities to be cleaner and greener. But what does that even mean? “Greenness” is a concept that’s hard to pin down – there’s no official list of the top 50 most eco-friendly cities, nor any widely agreed set of measurements for working out how green a city actually is.

In the realm of environmental science, concepts such as biodiversity can be assessed using indicators that give a standard set of measurements – for example, the number of different species of birds spotted in a given area on a given day. But for greenness or eco-friendliness, the possible indicators are endless, covering everything from road transport to recycling.
[infobox]Measuring a city’s relationship to its environment, they write, is “complex” and “challenging”, and eco-cities cannot easily be compared.[/infobox]In a 2015 study published in the journal Ecological Indicators, scientists based at the Lawrence Berkeley National Laboratory in California have fine-tuned a potential method for assessing Chinese “eco-cities” using 33 key indicators. So, for example, they propose to measure renewable energy usage by looking at the percentage of total energy purchased by a city that comes from renewable sources (not including nuclear).
From our partners:
Other “green indicators” in this study include the share of all “trips” made by public transport, and the daily average concentrations of air pollutants – plus a surprising number of social and economic variables, such as healthcare practitioners per 1,000 citizens and unemployment rates.

The study’s researchers have also reviewed other systems for assessing a city’s greenness, coming up with 14 international-level methods. But they conclude that, in essence, there is no good system. Measuring a city’s relationship to its environment, they write, is “complex” and “challenging”, and eco-cities cannot easily be compared.
(It should also be noted that, in general usage, the term “eco-city” is ill-defined, and that despite China’s plans to establish hundreds of them, it’s not actually clear what constitutes the status “eco”.)
In the absence of an accepted scientific indicator system, the EU’s Green Capital programme at least has a rigorous shortlisting process based on a technical assessment covering aspects such as biodiversity, green spaces and how a city deals with wastewater, noise and air quality. The programme, however, is limited to European cities and, furthermore, to those that actually apply for consideration – the most recent winners are Copenhagen, Bristol (the current incumbent) and, for 2016, Ljubljana.

Slightly less “skewed”, perhaps, is the Siemens-sponsored Green City Index put together by The Economist Intelligence Unit. Since 2009, the German engineering giant has been publishing reports assessing one region at a time, starting with Europe and working through Latin America, the US and Canada, Africa and, last year, Asia. In total, 120 cities have been scrutinised via indicators under the following subject headings: energy & CO2, transport, water, air quality, land use & buildings, waste, sanitation and environmental governance.
[infobox]How to compare cities in vastly different economic situations – is it fair to compare the developing and developed urban worlds?[/infobox]Although it’s difficult to compare cities from different regions, especially as data from each was collected at different times, the Green City Index does attempt to rank cities, from those that perform well above average for their region down to those that perform well below average. So who are the winners?
Copenhagen was a predictable victor in the European region, scoring 87 compared to London’s 72 (in 11th place) and Kiev’s bottom-of-the-pile 32. Despite its enthusiasm for bikes, Copenhagen finished behind Stockholm and Amsterdam in transport – but made the top seven in every category.
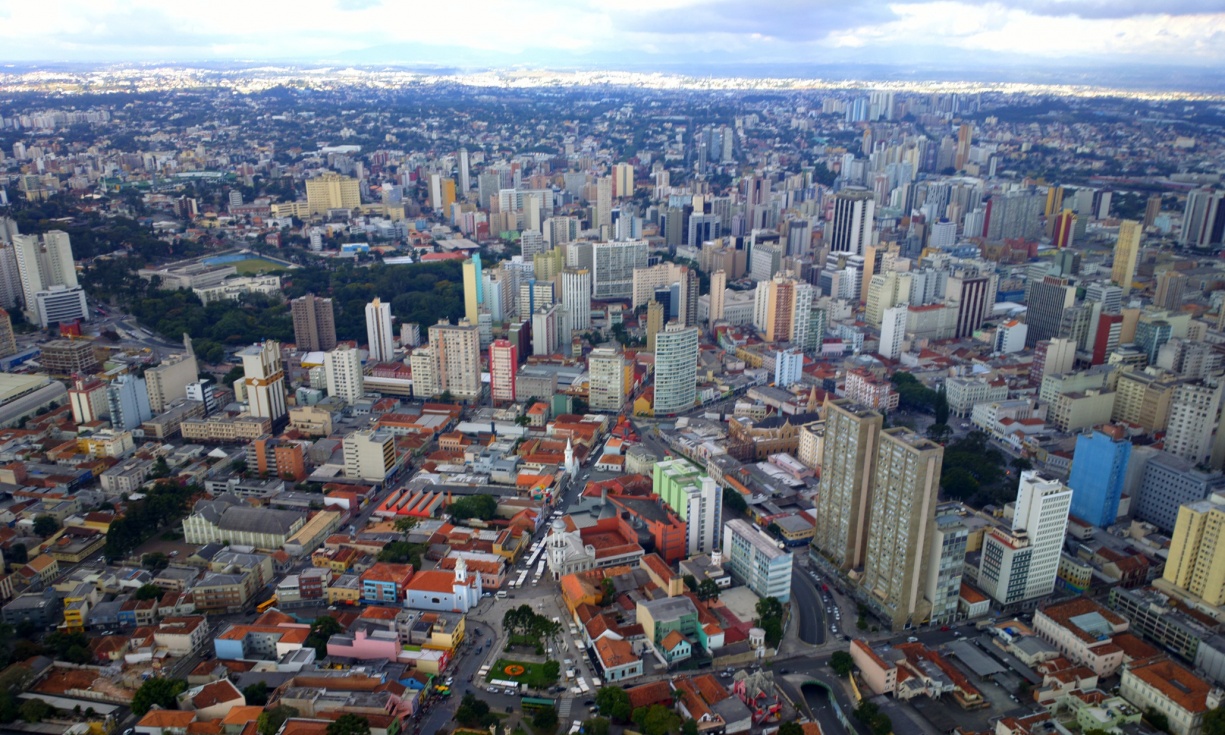
Curitiba in Brazil, San Francisco in the US and Singapore came top in their respective regions, with Singapore’s waste and water reclamation policies setting it apart from 21 other Asian cities (20% of Singapore’s water is purified from wastewater using cutting-edge technologies). In Africa, none of the 15 cities that were assessed performed well above average, but two performed well below – Dar es Salaam in Tanzania and Maputo in Mozambique.
The Green City Index is certainly not the perfect system. Its data comes from cities that have different ways of collecting it, and certain city-level data is missing or has to be extrapolated. And another problematic issue it raises is how to compare cities in vastly different economic situations – is it fair to compare the developing and developed urban worlds?
One interesting finding to come out of the Siemens studies is that both richest and poorest cities in a region often outperform middle-income ones. The average resident of Kuala Lumpur, for example, uses 497 litres of water per day and produces 816 kilograms of waste per year. Contrast these statistics to those of relatively richer Singapore – 309 litres of water and 307 kilograms of waste – or relatively poorer Delhi: 209 litres of water and 147 kilograms of waste. In the midst of economic growth, it seems, consumption overtakes sustainability and isn’t curbed until a city becomes positively wealthy. The “tipping point” in Asia appears to be a per capita GDP of around US $20,000.
Perhaps we’re making this too complicated. Why not stop pretending “greenness” is a measurable thing, and instead focus on the details we’re actually interested in? For example, which cities have the cleanest air or the lowest greenhouse gas emissions? Yet even then, it’s still difficult to find data of this type that has been collected and reported on consistently across a wide number of cities.
The World Health Organisation collects data on air quality from 1,600 cities worldwide, but the data is pieced together like a patchwork from different types of sources. And there is no list of the world’s biggest fossil-fuel burners on a city-by-city basis. The Global Protocol for Community-Scale Greenhouse Gas Emissions is a common standard for city-level greenhouse gas accounting, but that was only launched in December.
As more genuinely useful, comparable measures are developed for city-level use, it should become clearer which cities are performing best. Singapore, San Francisco, Curitiba and Copenhagen seem the most obvious candidates for the planet’s “greenest” title right now – but as better data emerges, others may begin setting new benchmarks.
This article is written by Hayley Birch and originally appeared in The Guardian.

From our partners:


