


The historic district in the small seaport city of Portsmouth, New Hampshire is an architectural treasure, with a mix of Georgian, federal and colonial styles. Many buildings are made of so-called Portsmouth brick, a distinctive kind that appear handcrafted. The picturesque streets attract thousands of tourists every year, creating demand for new hotels and retail. Now, the city faces the challenge of balancing that growth with the strong desire of citizens to preserve its celebrated heritage.
“People have a lot of opinions and care about what Portsmouth will look like in the next 20, 30 years,” says Jared Foley, a native of the city and director of visualization at the design firm Tangram 3DS. “There is a big concern among the public that new projects coming in aren’t appropriately taking the aesthetics of Portsmouth into consideration.”
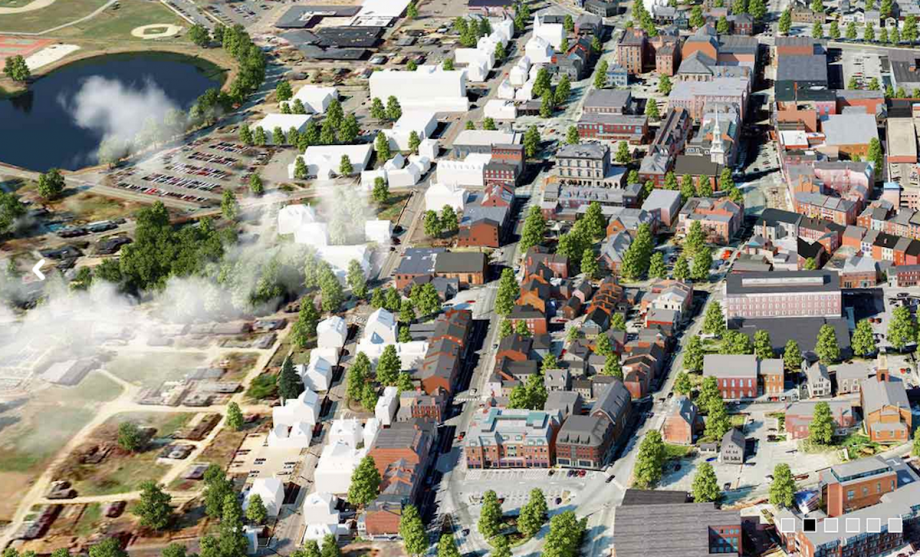
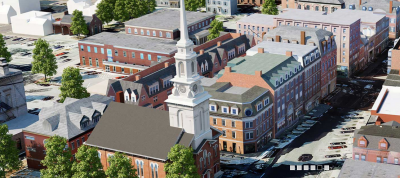
In order to determine how best to integrate new development into the historic fabric, Tangram 3DS has created a 3D map of nearly the entire historic district. This project is part of a larger shift toward using technology to plan for aesthetic purposes.
Foley and his colleagues started with a “3D massing model,” which represents 800 buildings in a simplified manner — with the correct dimensions but without any visual detail. The second step of the process was to “texture” most of these buildings. Using more than 6,000 photographs, they added details such as windows and color. They can then insert hypothetical buildings into the scene, providing a realistic picture of how the streetscape would look under different paths of development.
From our partners:
The goal of the maps, which were solicited by the city, is to enable architects, developers and the public to see how proposed buildings would look in context. Developers are, in fact, now required to show before-and-after images for major infill or redevelopment projects at planning meetings. The visuals are also available at a web portal so the public can see them at any time. You can zoom in and out, and see 360-degree views. “It allows the public and everyone involved to have a much more transparent conversation,” says Foley.
The basic concept is not entirely new; the Boston Redevelopment Authority began assembling a 3D map of that whole city in the early 2000s. Tangram 3DS has been working on its methodology for the past decade, and achieved the current, efficient process — including the “texturing,” which is the firm’s specialty — about five years ago. Only recently, with innovations in the software and advances in computing power, has the firm been able to take on projects of this scale.
Another new method, outlined in a recent paper, offers a way of assessing the panoramic views of cities. The underlying idea is similar to Tangram’s approach: to use computer software to examine urban aesthetics and catalyze conversations and planning decisions.
Santiago Pardo Garcia, a doctoral candidate at the University of Malaga, and his coauthor, Professor Matias Merida Rodriguez, identified three factors that contribute to a panoramic view: the swath of the city that’s visible, the angle, and the distance between the viewer and the scene. They calculated numeric values for all of these factors for all the different points in several Spanish cities: Granada, Osuna and Jaen. The resulting maps display these numeric values, indicating the locations in each city with the best panoramic views. Similar tools exist, but they are more limited in scope, typically tailored to a single city, such as Seattle, Portland or London. Pardo Garcia says that what sets his program apart is that it can be applied to any city. It uses open-source software, so, with the proper training, in theory any city could use it.

His intent is to provide a tool for planning — to reveal promising locations for, say, parks and paths with spectacular views. By the same token, it can help to identify places where development would deprive residents of such vistas.
Indeed, Pardo Garcia was motivated in part by much the same feeling that spurred the Portsmouth project: a preservationist instinct. “Here in Spain in the last decades, we have had very intense building construction and activities. Our cities have changed a lot,” he says. “For me it’s a pity to see how the historic views are not possible nowadays.”
A skeptic might wonder if his tool is simply assigning numbers to what residents already know. Pardo Garcia acknowledges that most of the best views are already well-known, but this tool can systematically inventory them, ensuring that none escape notice (and catching private locations that would be impossible to visit). And in some circumstances, the tool can be more revealing. If a city wants to plan a park within specific parameters, say, the method could quickly identify the best panoramic views within that area, which may not be renowned but are still worth capitalizing on.
He and the Tangram 3DS team wonder if development might have unfolded differently had their tools been available sooner. But of course, aesthetics will always be only one of many competing factors; political and economic interests might have prevailed regardless. Still, these map-makers are enlisting the tools of the future in the hopes of maintaining a connection to the past.
This feature originally appeared in NextCity.

From our partners:


