


“Fat” may be the new normal in America. Drawing on data from the Centers for Disease Control and Prevention, a report from JAMA Internal Medicine found that more than three quarters of American adults today are either overweight or obese. And for the first time in history, the number of obese people has surpassed that of the overweight.
In the past two decades, especially, America’s weight problem has grown dramatically, inspiring a surge of new programs and products designed to promote better health and help Americans shed the extra pounds.
But new statistics published by the Physical Activity Council suggest a need for more aggressive efforts to combat the issue. In 2014, nearly 83 million Americans were completely inactive, the highest number reported since 2007. A sedentary lifestyle, or lack of physical activity, is one of the leading causes of obesity in addition to other factors such as genetics, emotional instability and lack of sleep.
With traditionally hearty-eating holidays approaching, WalletHub’s analysts compared the 50 states and the District of Columbia across 12 key metrics to pinpoint where the weight problem is most prevalent and encourage Americans to re-evaluate their lifestyles. Our data set ranges from the percentage of adults and children who are overweight and obese to the sugary-beverage consumption among adolescents. The results, additional expert commentary and a detailed methodology can be found below.
From our partners:
Main Findings
In the graphic and table below, a rank of No. 1 corresponds to the state with the biggest weight problems.
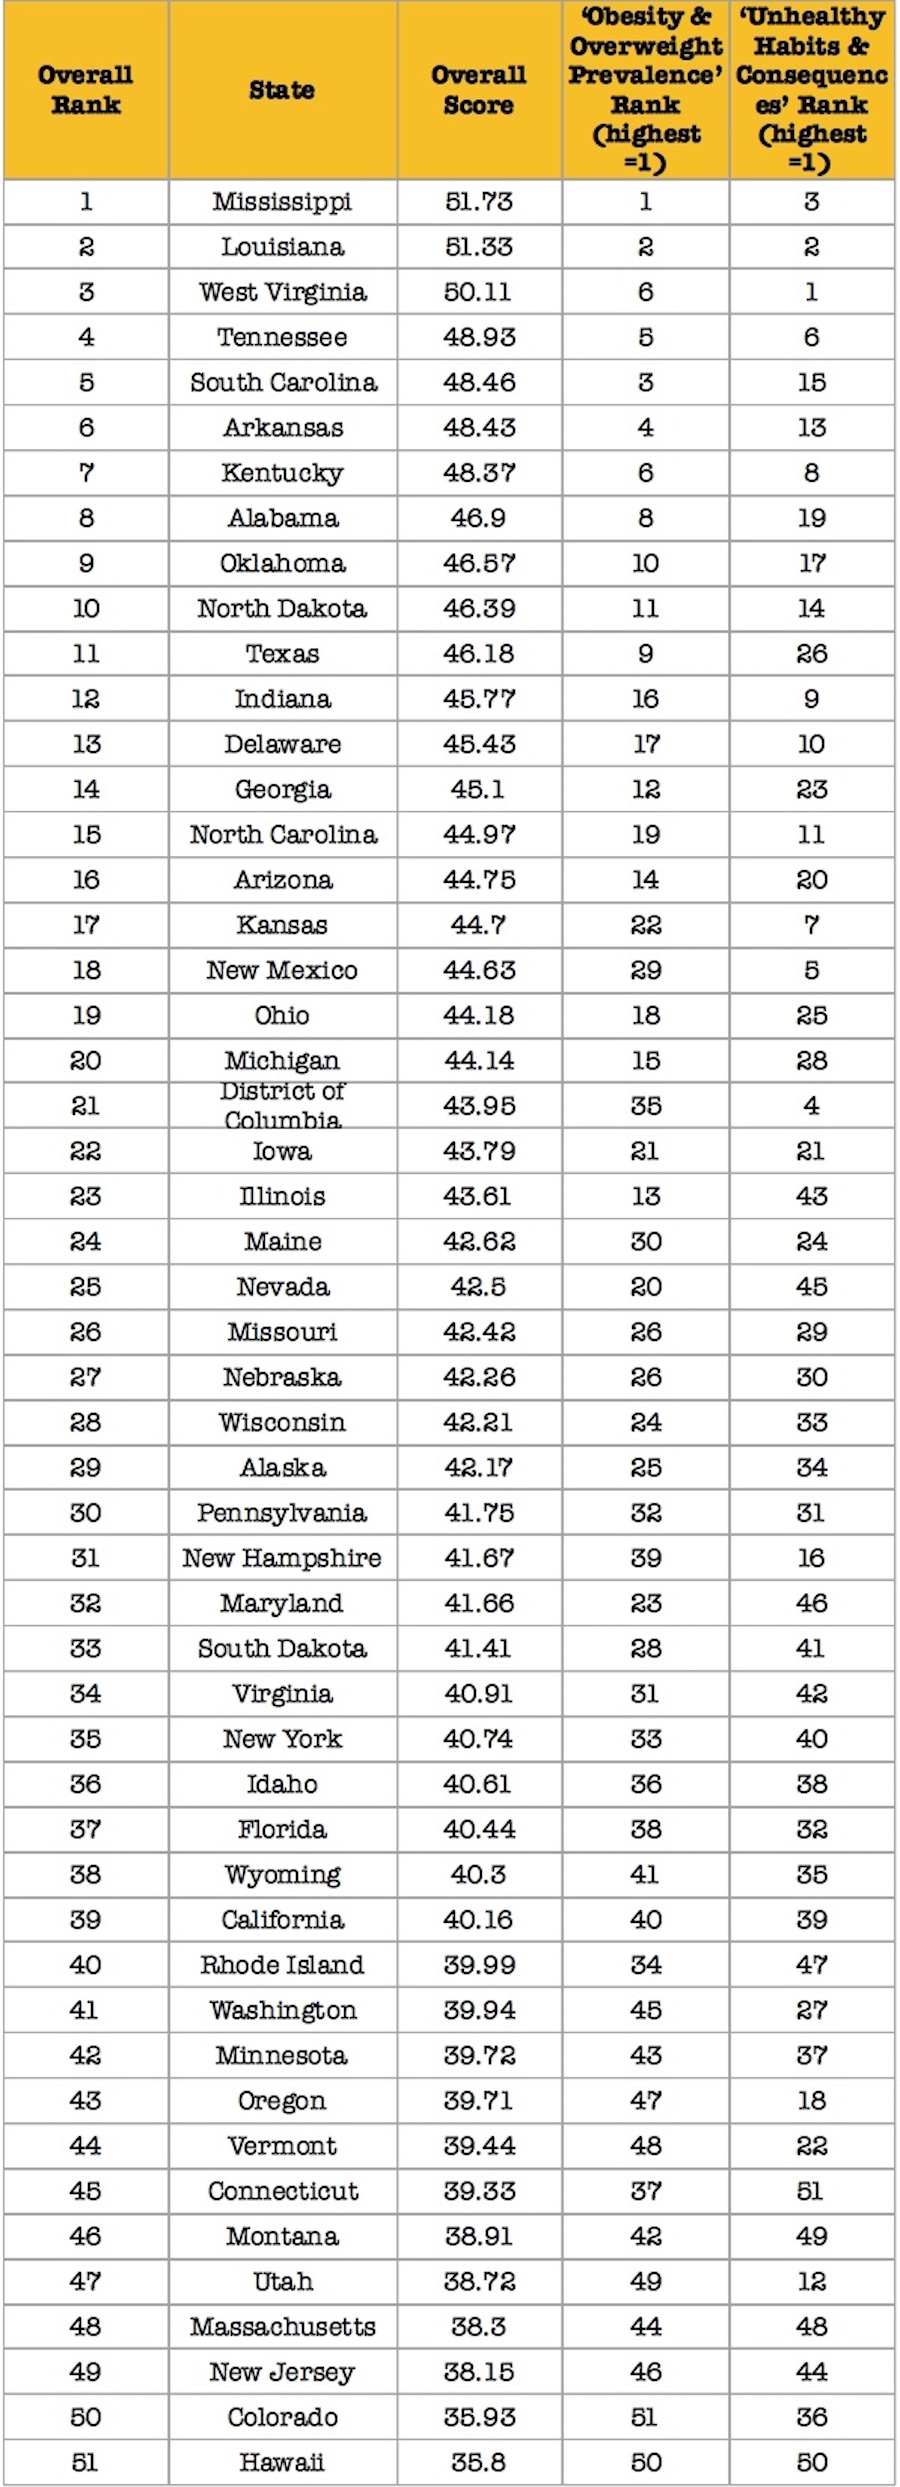
 Most & Least Obese States
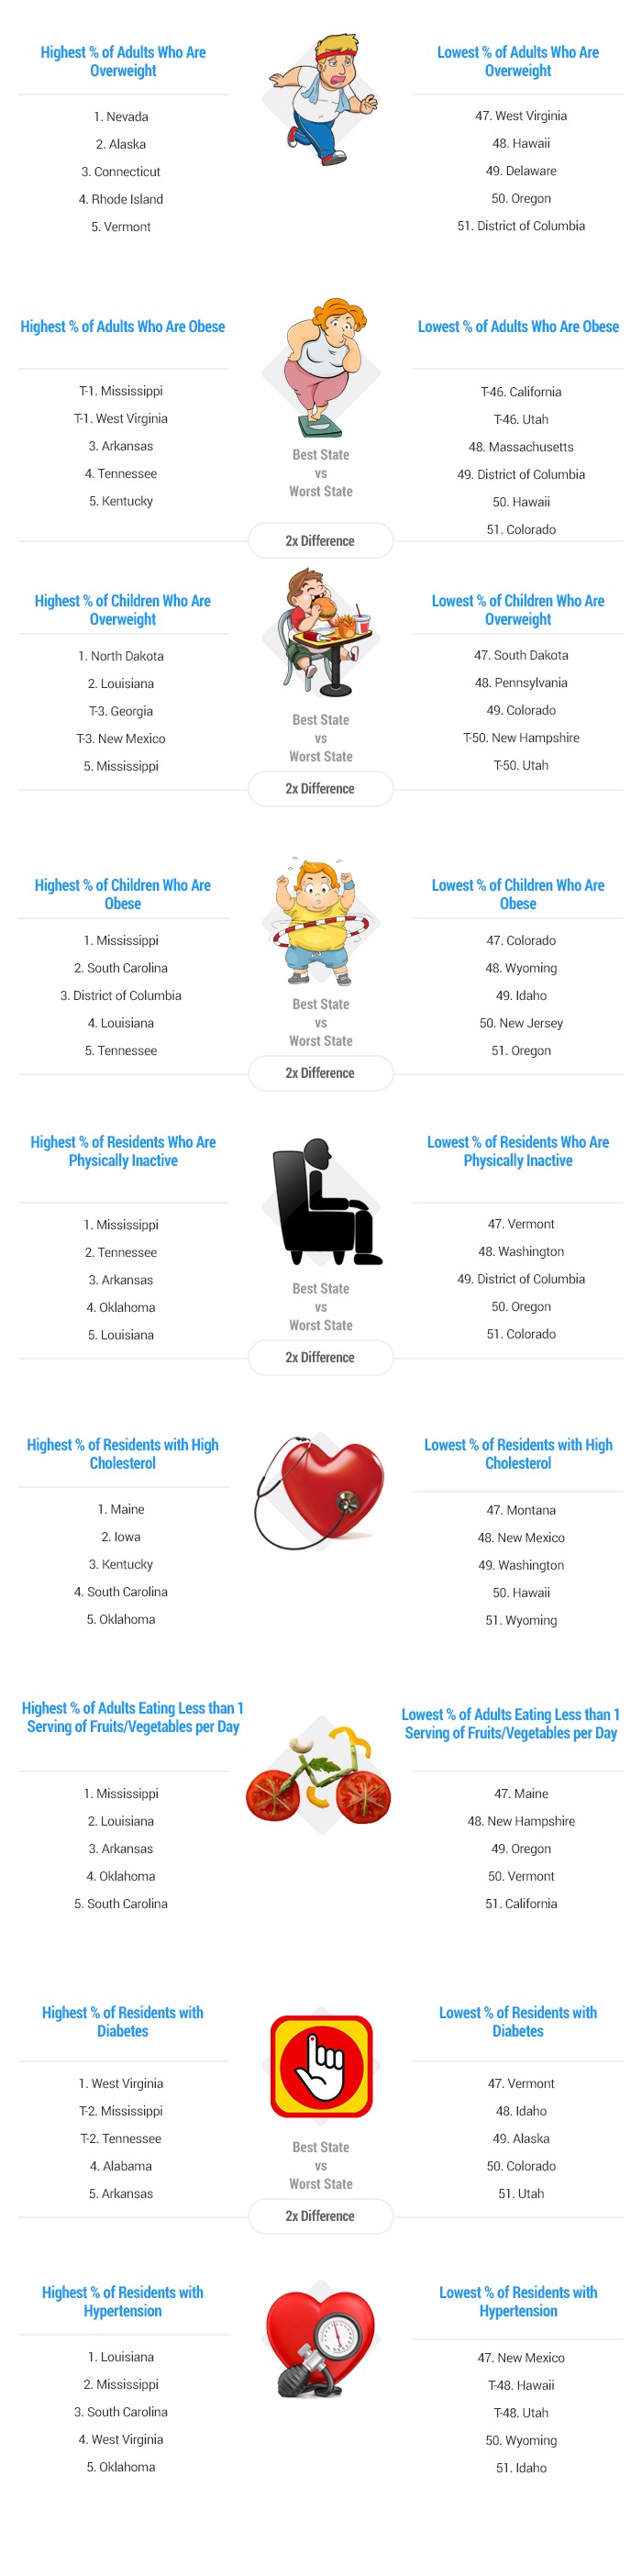
Although this report examines the prevalence of obesity, it also evaluates the levels of inactivity and overweight in each state. However, given the particularly harmful effects of obesity, we constructed a separate table below that focuses just on obesity rates to highlight the states in which the problem is most concerning. Both adults and children were considered for this separate ranking. The state with the highest ranking (No. 1) has the highest obesity rate.
Ask the Experts
According to the Campaign to End Obesity, Americans spend nearly $200 billion annually on health-related costs due to obesity. And our collective medical tab is just one of the consequences of a perpetually unhealthy lifestyle. To shed more light on the issue and find solutions that consumers and local governments can follow, we consulted a panel of experts in various fields such as health and labor economics. Click the experts’ profiles to read their bios and thoughts about health and obesity.
Methodology
In order to identify the states with the biggest weight problems, WalletHub’s analysts compared the 50 states and the District of Columbia across two key dimensions, including “Obesity & Overweight Prevalence” and “Unhealthy Habits & Consequences.”
To obtain the final rankings, we attributed a score between 0 and 100 to each metric. The more points a state accrued, the bigger its weight problems are. Therefore, 100 points = the worst state. We then calculated the weighted sum of the scores and used the overall result to rank the states. Together, the points attributed to the two major dimensions add up to 100 points.
Obesity & Overweight Prevalence – Total Points: 70
- Percentage of Adults Who Are Overweight: Full Weight (~11.67 Points)
- Percentage of Adults Who Are Obese: Double Weight (~23.33 Points)
- Percentage of Children Who Are Overweight: Full Weight (~11.67 Points)
- Percentage of Children Who Are Obese: Double Weight (~23.33 Points)
Unhealthy Habits & Consequences: 30
- Percentage of Residents Who Are Physically Inactive: Full Weight (~3.75 Points)
- Percentage of Residents with High Cholesterol: Full Weight (~3.75 Points)
- Percentage of Adults Eating Less than 1 Serving of Fruits/Vegetables per Day: Full Weight (~3.75 Points)
- Percentage of Residents with Diabetes: Full Weight (~3.75 Points)
- Percentage of Residents with Hypertension: Full Weight (~3.75 Points)
- Sugar-Sweetened Beverage Consumption Among Adolescents: Full Weight (~3.75 Points)
- Death Rate Due to Obesity: Full Weight (~3.75 Points)
- Healthy-Food Access (percentage of urban-area residents with low income and living more than 1 mi. from a grocery store or supermarket): Full Weight (~3.75 Points)
Sources: Data used to create these rankings were obtained from the Centers for Disease Control and Prevention, the Child and Adolescent Health Measurement Initiative, Trust for America’s Health and the United States Department of Agriculture Economic Research Service.
This feature originally appeared in Wallethub.


From our partners: