


Employment may have rebounded since the Great Recession, but the staggering regional gaps in both real wages and productivity are getting worse.

Since the Great Recession, the economy has recovered on several key fronts—the stock market has rebounded, unemployment is down, the labor market has tightened, and employers are looking to fill jobs with talented workers. But for many millions of Americans, that recovery remains invisible: Their wages and productivity—two key measures of economic dynamism—have stagnated. Worse, both remain highly unequal and uneven across the nation, according to two new analyses.

The first analysis by the economic data and modeling firm Emsi finds the pace of wage gains across metros has been slower than would be expected given the economic recovery. Nationally, real private sector wages grew by 0.8 percent annually between 2012 and 2016, which is anemic given an unemployment rate of 4.4 percent or so.
More troublingly, wage gains have been concentrated in a very small number of places. Just two percent of metropolitan and micropolitan areas (19 of 934) saw their real private sector wages per job grow by an annual 3 percent between 2012 and 2016. Another 51 metros saw them grow by 2 percent. Meanwhile, real wages declined in roughly 15 percent of metros (139 of them) over the same period.
From our partners:

Have a look at the screenshot from an interactive map above via Emsi. Metros with real wage growth are blue; red shows where real wages have declined; and white indicates almost no real growth or decline. Tinkering with the map’s range provides more detail on wage gains and losses across the country over this time period.
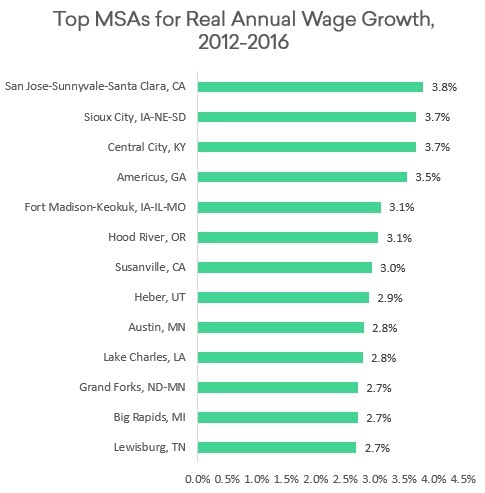
The table below pinpoints the metros which have posted the largest average annual wage gains between 2012 and 2016. Silicon Valley (San Jose) tops the list with annual wage growth of 3.8 percent over this period. But the rest of the list mainly includes smaller metros: Sioux City, Iowa-Nebraska-South Dakota; Lake Charles, Louisiana; and Grand Forks, North Dakota-Minnesota. Indeed, just five of the 100 most populous metros experienced real wage gains of at least 2 percent—they were San Jose, Seattle, San Francisco, Raleigh, and Madison.
A second analysis, from the Brookings Institution’s Metropolitan Policy Program, finds a similar productivity gap. Overall, the nation’s productivity averaged $113,000 per worker in 2015. In large metros, the figure is about 20 percent higher than in smaller ones: The 100 largest metro averaged productivity of $119,000 per worker compared to $99,000 per worker for smaller ones. On average, the 10 most productive ones are 66 percent more productive than the bottom 10.
And the most productive metro (the West Texas oil town of Midland, at $299,000 per worker) is nearly 8 times more productive than the least (Jacksonville, North Carolina, at $38,000 per worker).

Generally speaking, large productivity gains were concentrated in superstar cities and tech hubs on the coasts—in Northern and Southern California metros of San Jose, San Francisco, Los Angeles, San Diego, and Oxnard; along the Bos-Wash Corridor, especially New York and Bridgeport and Hartford, Connecticut; as well as the knowledge hub of Seattle and the energy hubs of Houston and Midland. Once again we see the twin pillars of what I have termed America’s new knowledge-energy economy, although the energy pillar has sunk a bit as energy prices have fallen.
[infobox title=’The Brookings analysis concludes:’]Where before the 2000s the productivity of cities had been converging, with the laggards catching up to the leaders, it now appears that a shorter list of “superstar” metros with high skills and high technology endowments are pulling away from the other regions. This is troubling, because labor productivity is not just another abstract economic statistic. To the contrary: Regional productivity comes about as close as is possible to providing a top-line metric of regional well-being, especially because metro areas with higher labor productivity tend to also have higher incomes and lower poverty rates. Given that, it is worrisome that the stars may be pulling away and that only small pockets of the country—tech hubs, energy boomtowns, or college towns—have registered productivity gains in the recent decade.
[/infobox]But what might be driving this uneven winner-take-all pattern?
In a previous analysis for CityLab, I found metro productivity to be closely correlated with size (.42) and density (.43); high-tech industry (.56) and startups (.67); education (the share of adults with college degrees, .54); and the share of workers in knowledge, professional, and creative occupations (.52).
These two studies provide more evidence for a story that’s been dominating so many of our conversations about cities for many months: The U.S. is facing burgeoning spatial inequality, and this regional divide is fueling a populist backlash that is ripping the nation ever further apart.
This feature originally appeared in Citylab.

From our partners:


