


 People often link Austin, Texas, and Ann Arbor, Michigan, as sister cities. Both are home to anchor universities with leading research institutions and quasi-professional college football teams; both are politically liberal enclaves with large student populations and a small-town feel.
But on at least one key metric—labor force participation rate—Austin has more in common with Salt Lake City, Utah. And when it comes to housing standards, Ann Arbor is closer in kind with Knoxville, Tennessee.
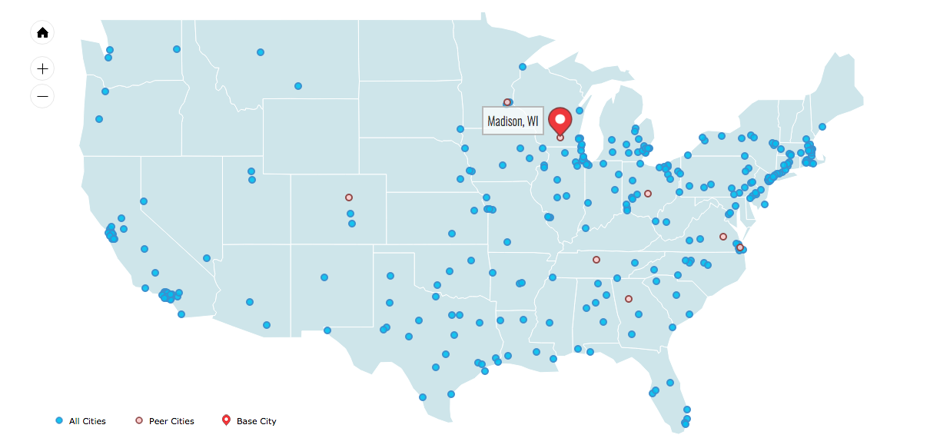
A new tool just launched by the Federal Reserve Bank of Chicago looks at the notion of sister cities from a more detailed perspective than the comparisons that residents sometimes reach for (“Hook ‘em Horns!” vs. “Go Blue!”). The Peer City Identification Tool is like a DNA test for civic data, allowing users to tell at a glance where certain cities’ specific interests and challenges align, and where they deviate—in effect, who their real siblings, cousins, and other relatives are.
Susan Longworth, senior business economist for the Community Development and Policy Studies Division at the Federal Reserve Bank of Chicago, says that the tool is the result of a series of some 300 interviews with leaders of cities across the Midwest and Northeast.

From our partners:
Rather than simply publish a report, the Chicago Fed decided to present the data they collected through a mapping tool, using four vectors: equity, resilience, outlook, and housing. “Resilience” focuses on economics and the labor market: unemployment, median family income, and labor force participation, plus changes in those metrics over time. “Equity” involves social factors: dissimilarity indexes, for example, to measure segregation.
Perhaps that’s not so surprising about Austin. But some of the findings in the Midwest are unexpected. The Chicago suburb of Aurora, Illinois, enjoyed a 40 percent boost to its population between 2000 and 2015. Its population is 25 percent foreign born, mostly Latino, linking it to Bakersfield, California, and Fort Worth—two cities with similar outlooks, according to the Peer City Identification Tool.
“The common narrative out there really is that manufacturing has decimated these Midwestern cities,” Longworth says. “We wanted to understand that a little more. There are more nuances to this story.”
This feature originally appeared in Citylab.


From our partners: